Pond Mate software

This Section Is For Advanced Hobbyists Discussing new original cutting edge Experimental and Trial Treatments and Surgical Techniques, here we take koi health and pond keeping to the next level

Moderators: B.Scott, vippymini, Gazza, Manky Sanke

User avatar
Duncan
Site Admin
Site Admin
Posts: 2883
Joined: Tue Aug 09, 2005 5:40 pm
Location: west Midlands UK
Contact:

Pond Mate software

Post by Duncan »

Here is a break down of the new software first thing to do is make a copy with the save as function in excel save as “pond mate master copy ” then work from this one

down load here http://www.koiquest.co.uk/koiquest%20Pond%20Mate.xls
First graph

On this first graph this will track you KH/GH/TDS/and pH the PPM are read from the left while the pH because it runs in a different scale is read on the scale the right
Remember you will have a blank copy to create you r own graph these lines are exap0mple parameters put in to explain. hopefully you will then see what happens to your PH and KH how they interact with each other

so this is the first page the pH /KH etc graph . if you have a large screen if you place the curser on the bottom right hand corner of the graph the curser will change to a double headed diagonal black arrow click and hold when it does this and drag the graph out to fill your screen then save .( this was done on a 15inch monitor some every one could view it I have a 28 inch so had to drag it out to improve the size for my screen

the right of the graph is the legend which tell you want all the colours are linked to I.E GH/pH.GH etc\: if you look at the bottom of the spread sheet tabs A-B-C-D-E will navigate you to all the other sheets/graphs and input data fields

Image

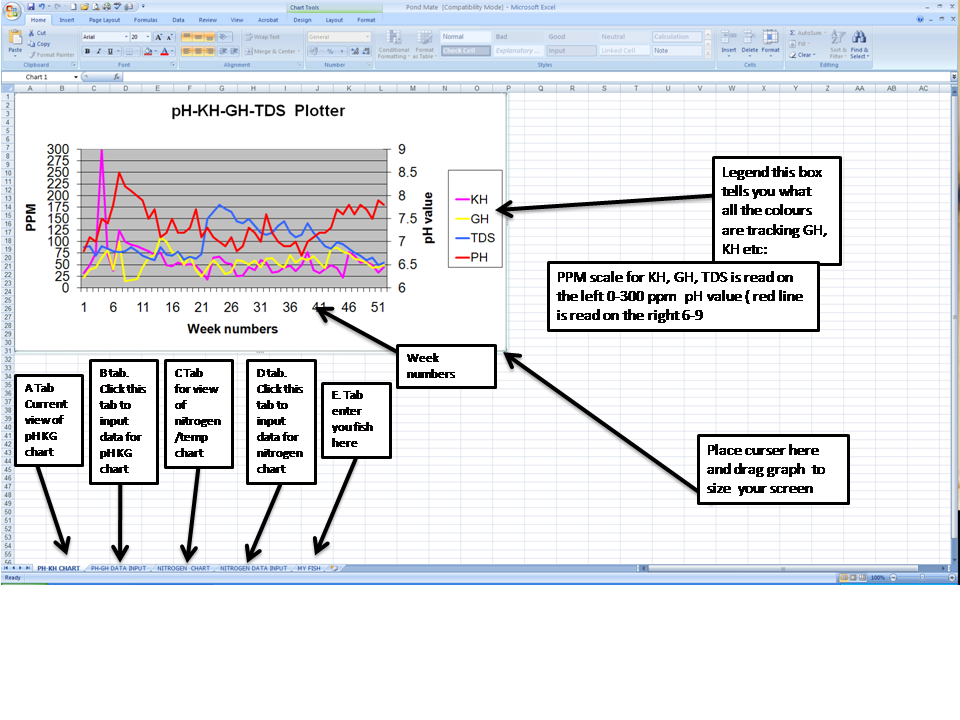
To input the date for this graph click tab B at the bottom

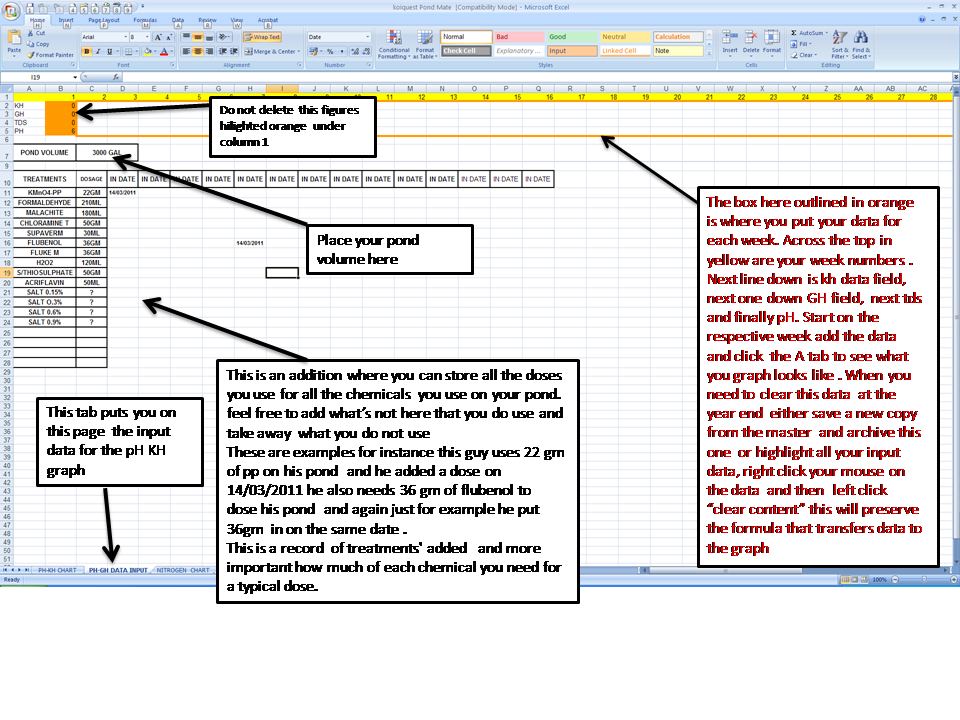
At the top you will see an outlined box in orange , yours will be blank now but this is an example .

On the top in yellow are the week numbers and she be left alone on the left of the orange box are your title parameters and should also be left alone inside the orange box is where you enter you data every week through out the year for GH/KH/tds/pH , as soon as you put a value in for4 each week this will show up on the graph on the previous tab

At the end of the year when you want to start again highlight all your input data excluding your title fields and week numbers and right click your mouse and left click “clear contents” or manually hit back space for every data input point ( the long way around it ) do not hit delete button this will wipe the formula and now do not delete the numerics in column 1 hilighted orange this is what makes the graph start from week one same applies to tab c on the nitrogen cycle
Under this is a section for recording for your own records treatment doses for every chemical used in your pond so you don’t have to get the calculator out every time you put a treatment in( this is a permanent record for you feel free to add or take away by over writing

So on the top we have your pond volume
Below the chemicals used and the dose rate for your pond to the right the enter the date you put a treatment in this was if you see a glitch in the graph you can have a look see if you put a treatment in so you can see from the example a pp was put in on 14 /03/2011

This pretty much coves this work sheet

Image

so we click on tab/sheet C

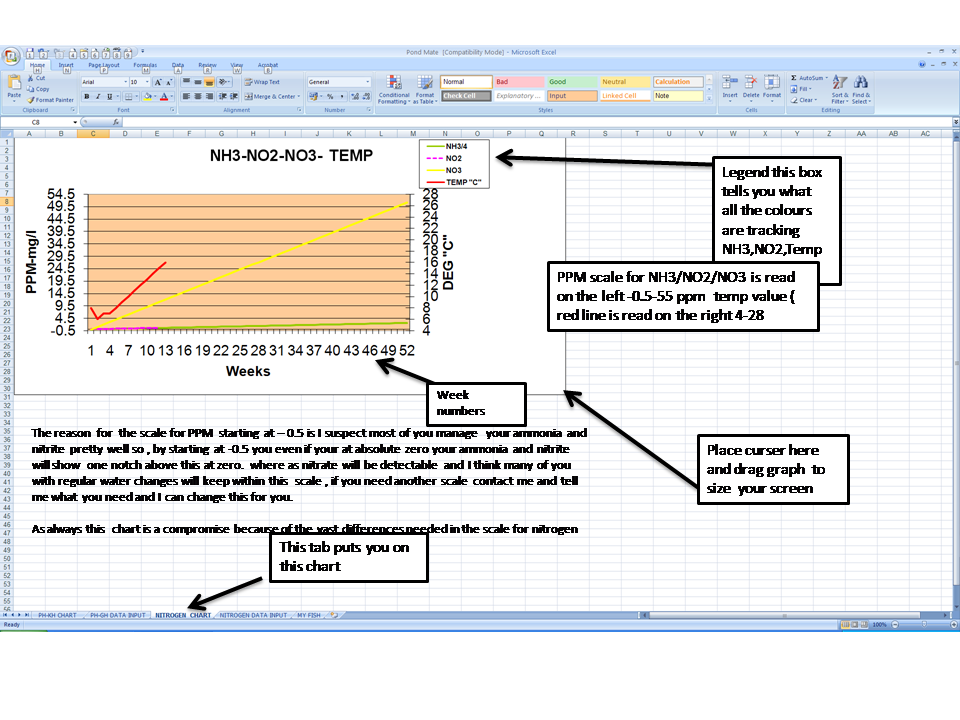
this is the tab that shows the nitrogen cycle of your pond Ammonia , nitrite, nitrate and temperature

this was a bit of a compromise as nitrate values are usually high where as ammonia and nitrite will be very low to zero . with this in mind I expect the NH3 and NO2 to be pretty flat and low where as NO3 will be readable . I wish we could have a zoom facility for NH3 and NO2 but io don’t know of one so I have started the reading on this side at -0.5 so it will show NH3 and NO2 as a line just above the weeks axis so you do at e3last have something to see

if anyone wants the Nitrate scale to be wider let me know and I can easily alter this to suit you but is suspect most of you operate within the scale similarly if you want it narrowed just shout up

The PPM is read from the left and the temp because it runs in a different scale is read from the secondary axis on the right . This pretty much covers this slide so to input the data for this graph click tab/sheet D

Image


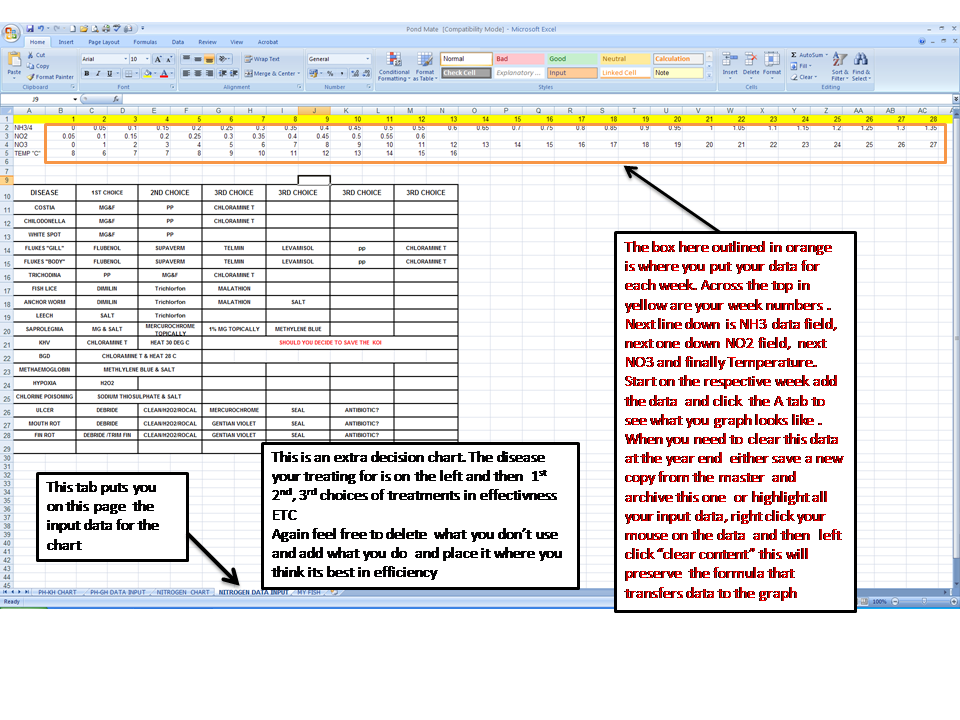
If you press Tab d this takes you to the sheet to input the data for the nitrogen graph

I don’t intend to go through the input data as this is the same as already described earlier so below this is a chart of all disease and a first second third preference of effectiveness of chemical for each (dependant on where in the world you are some of these may or may not be legal)

Please read the slide and gain feel free to delete or change anything in this treatment chart dependant on what works for you

Image

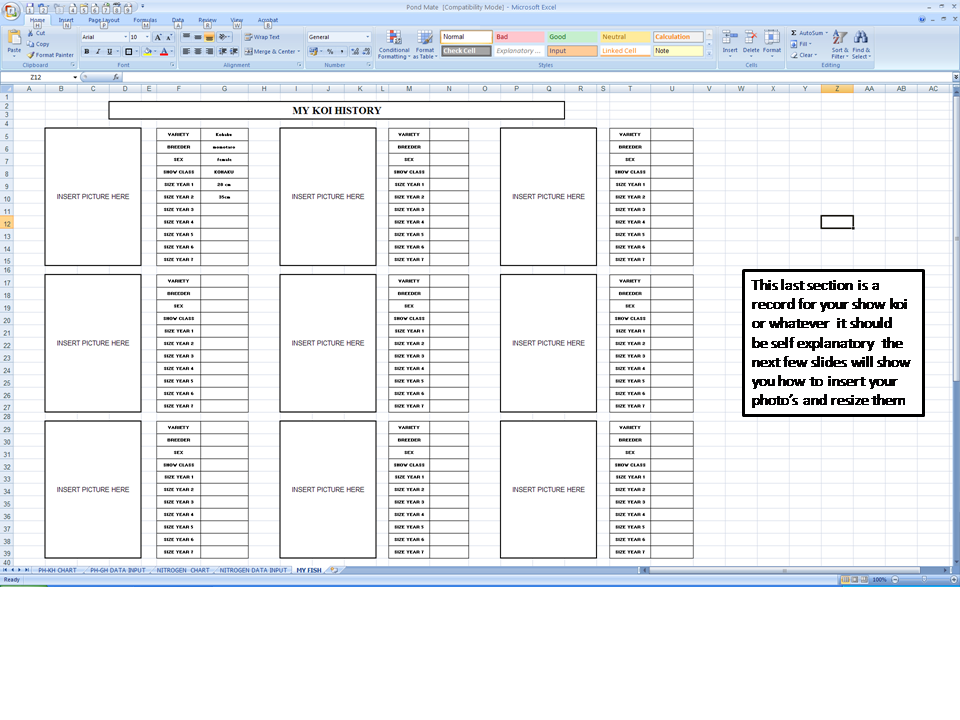
Hit the Last tab, tab/sheet E this will take you to the last sheet where you can store photo’s of you koi and data about them things like variety, breeder, show classification , size etc

The next series of slides show you how to upload your pictures and size them
Image


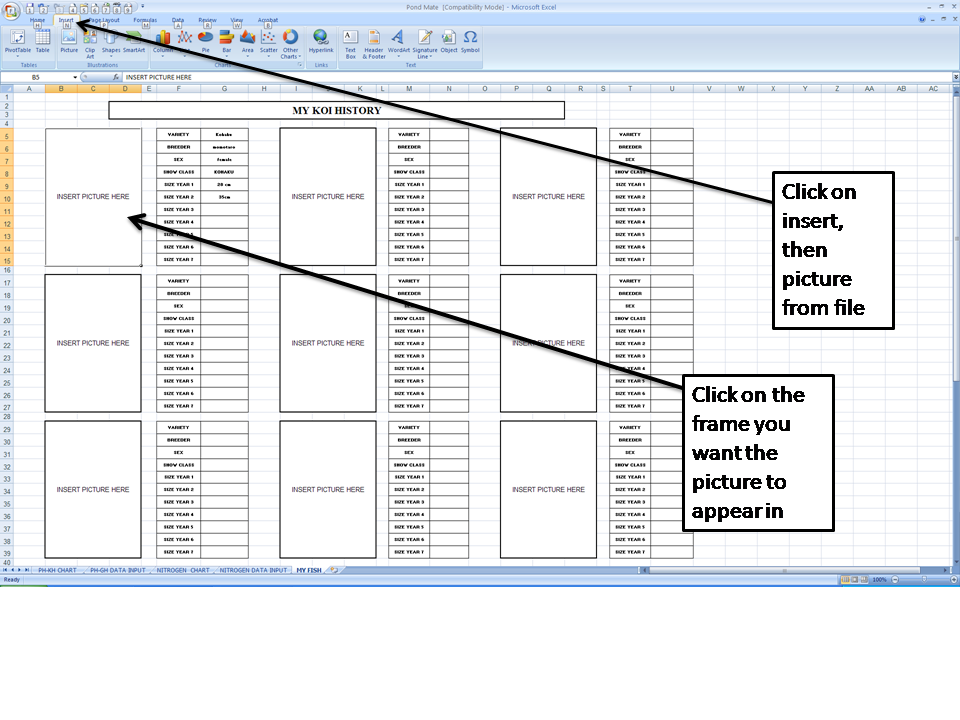
Ok on the next slide I have clicked on the square where I want the photo to go, I then go to the top and click insert (this may look different on your version of excel) so click insert –picture-from file. This will bring the browser up as shown on the next slide
Image


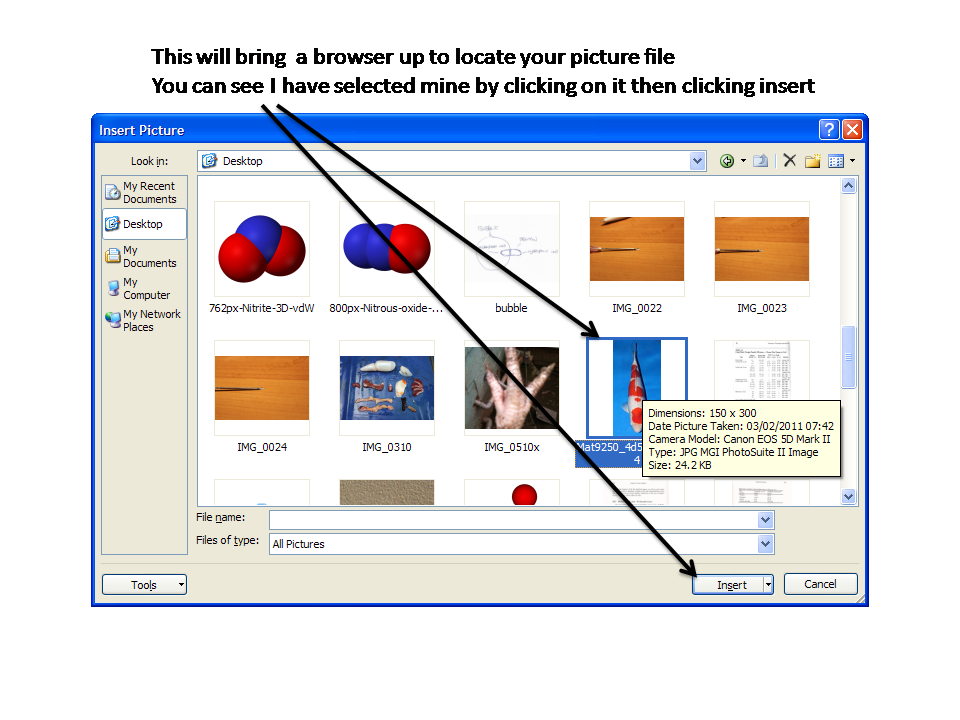
Here you select where you file is on the left, can see I have selected desk top on the left hand side this is where my photo was but . you click on your photo ( you can see I have selected mine, then click insert
Image


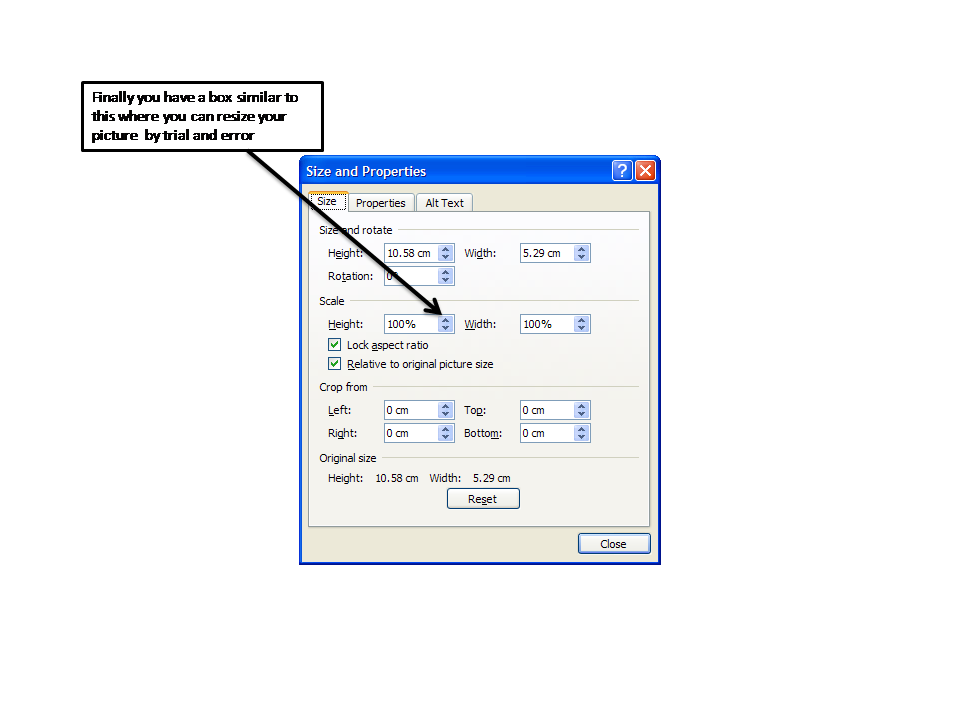
this has place the photo as in the next screen but you photo may be two big for the box in fact it probably will be. In this case you can either shrink you photo but clicking on a corner and dragging it to a smaller size or do as follows . right click on the photo, and select format picture or dependant on your version of excel size picture this will bring up the last screen

Image


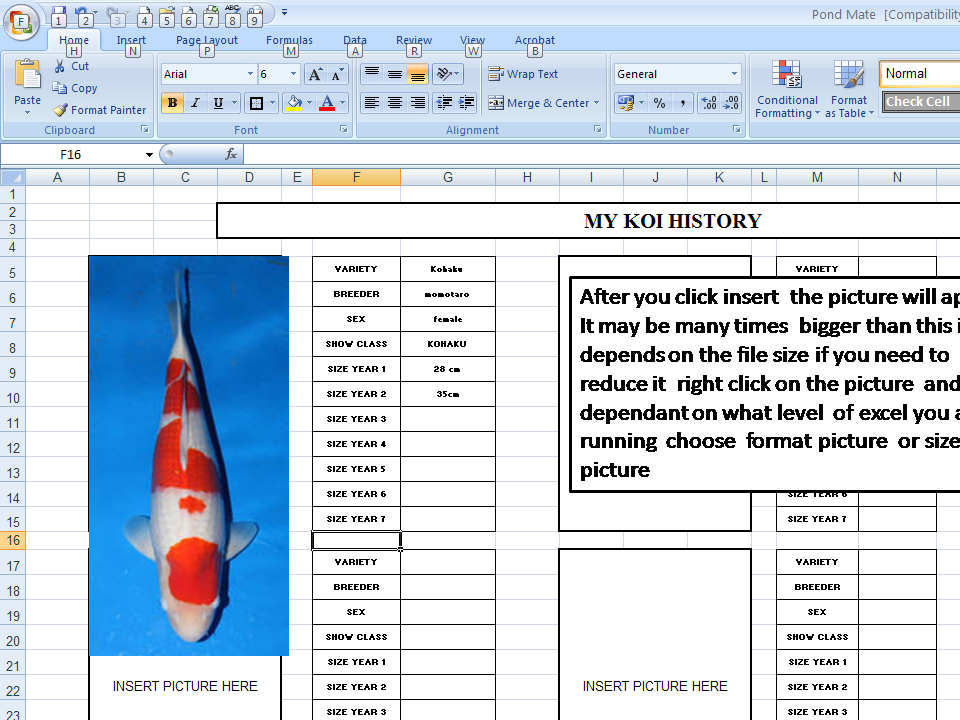
This is the picture properties box where you can click an up down arrow and resize the picture by percentage when done hit enter . this will be trial and error

Image


finally download here right click and save target [url]http://www.koiquest.co.uk/koiquest Pond Mate.xls[/url
User avatar
Gazza
architeuthis moderator
Posts: 5306
Joined: Sat Aug 13, 2005 7:24 pm
Location: Essex,UK
Contact:

Re: Pond Mate software

Post by Gazza »

Hi Dunc,

This looks the nuts mate i will have a go at this this afternoon hopefully :D
User avatar
Duncan
Site Admin
Site Admin
Posts: 2883
Joined: Tue Aug 09, 2005 5:40 pm
Location: west Midlands UK
Contact:

Re: Pond Mate software

Post by Duncan »

hi

i just thought, i have saved this as excel 97 -2003 file so just about anyone with office can open it as i use office 2010 and 2010 is not backward compatible unless i make it so, which i have done by saving it that way it can go forward or backward

im looking for feed back so i can release it to regular koiquest members

dunc
User avatar
Gazza
architeuthis moderator
Posts: 5306
Joined: Sat Aug 13, 2005 7:24 pm
Location: Essex,UK
Contact:

Re: Pond Mate software

Post by Gazza »

Hi Dunc,

On the treatment chart on the choices it only goes to 3rd is this just a typo and should be 4th 5th :?:

I cant seem to get my GH and stuff in as i don't have an Orange box and is i add anything on the KH or other lines nothing comes up on the graph,i know its me and will play about and try to sort it.

Not being picky mate as i know how hard your working on stuff at the moment :wink:
User avatar
Gazza
architeuthis moderator
Posts: 5306
Joined: Sat Aug 13, 2005 7:24 pm
Location: Essex,UK
Contact:

Re: Pond Mate software

Post by Gazza »

OK OK you know when you hit the button post and then realize your a Muppet (as we know i do this a lot) well a bloody graph ain't going to do much with only one set of readings in it me thinks :oops: :oops: :oops:

Yes i have a nice graph on the go now :D
User avatar
Duncan
Site Admin
Site Admin
Posts: 2883
Joined: Tue Aug 09, 2005 5:40 pm
Location: west Midlands UK
Contact:

Re: Pond Mate software

Post by Duncan »

gazza you wont have an orange box this by way o9f example

its not working at the moment so i will have to take it down and have a look at it

dunc
User avatar
Duncan
Site Admin
Site Admin
Posts: 2883
Joined: Tue Aug 09, 2005 5:40 pm
Location: west Midlands UK
Contact:

Re: Pond Mate software

Post by Duncan »

Gazza

down load it now http://www.koiquest.co.uk/koiquest%20Pond%20Mate.xls i think it fixed

you now have an orange box and also a hilighted orange set of numbers in column 1 do not delete or alter these


dunc
User avatar
Gazza
architeuthis moderator
Posts: 5306
Joined: Sat Aug 13, 2005 7:24 pm
Location: Essex,UK
Contact:

Re: Pond Mate software

Post by Gazza »

Hi Dunc,

It was me mate there was nothing wrong as i said above i had only put one set of readings in............sorry :oops: :oops: :oops: :oops: :oops: :oops:
Brockp
Hammer Head shark
Hammer Head shark
Posts: 223
Joined: Thu Nov 11, 2010 11:08 am
Location: Winchester

Re: Pond Mate software

Post by Brockp »

Hi Duncan;

Must have pressed the wrong button last night as my complimentary post about the new software is missing this morning.

I was pre warned so had two weeks data to enter, all worked fine. A very useful tool.

I couldn’t find anything that didn’t work.

I would however like E.C. and ORP added to the capture screens and graphed. I would love to follow these over time to see how they correlate.

Peter

PS If you are giving this away free I would at the very least ask people to make a donation to a charity you specify/
User avatar
eds
Great White Shark
Great White Shark
Posts: 850
Joined: Sun Sep 09, 2007 11:59 am
Location: Nottingham, UK

Re: Pond Mate software

Post by eds »

Brilliant Duncan. Dowloaded and saved for when the pond and QT are set up.
Brockp
Hammer Head shark
Hammer Head shark
Posts: 223
Joined: Thu Nov 11, 2010 11:08 am
Location: Winchester

Re: Pond Mate software

Post by Brockp »

Hi Dunc;

Can we use actual dates rather than week numbers; two reasons; being old and senile I forget the date of the last test, secondly and probably a better reason is that if we are using this for small pond volumes, and I notice myself and at least one other is, then a week is a long time in the life of a 200 gallon growing on pond.

Peter
User avatar
Gazza
architeuthis moderator
Posts: 5306
Joined: Sat Aug 13, 2005 7:24 pm
Location: Essex,UK
Contact:

Re: Pond Mate software

Post by Gazza »

Hi Peter,

You should (i think) be able to change the column to dates if you wish and the graph will still work and you will have your date in the column.
Brockp
Hammer Head shark
Hammer Head shark
Posts: 223
Joined: Thu Nov 11, 2010 11:08 am
Location: Winchester

Re: Pond Mate software

Post by Brockp »

Chow

I didnn't want to play with the model as I know how imposrtant version control is and I would assume we would want to pool all our data at some stage, hence putting the question back to the model owner.

I will wait for Duncan's or your blessing before I fiddle with the model.

Peter
User avatar
Duncan
Site Admin
Site Admin
Posts: 2883
Joined: Tue Aug 09, 2005 5:40 pm
Location: west Midlands UK
Contact:

Re: Pond Mate software

Post by Duncan »

Brockp wrote:Hi Dunc;

Can we use actual dates rather than week numbers; two reasons; being old and senile I forget the date of the last test, secondly and probably a better reason is that if we are using this for small pond volumes, and I notice myself and at least one other is, then a week is a long time in the life of a 200 gallon growing on pond.

Peter
hi peter

great to see you taking an active interest , with regards you question, the weeks could be days or even hours it depends how youlook at it if tha name bothers you, you just have to change the legend under the numerics by right clicking on the axis or the graph itself and selecting format i think that actual date as say 12/4/2011 is Irrelevant where as you could say we had a problem on day 12 of the quarantine but its your call

for me i think weekly is going to be more than most can manage so i'll stick at that

while we are on the subject i have a new version which i'll put up the weekend

it has a function called "interpolated" what this does is: if you miss a week instead of the graph line dropping to zero then spiking back up again the next week this will simply draw a line direct from your last reading to the next regardless of how many weeks you missed . particluarly good if you have been away so the line doesnot dip to zero leaving you wondering what happened here?

also i have it now so your line starts from week zero so if your first data input was week 12 for instance ( this week is week 12) it would draw your first line for that parameter from week zero rather than half way between the week before
i have also go it tracking bang on the week number rather than the more usual ofset half way, as is usual

so i have been busy refining it

dunc
User avatar
Duncan
Site Admin
Site Admin
Posts: 2883
Joined: Tue Aug 09, 2005 5:40 pm
Location: west Midlands UK
Contact:

Re: Pond Mate software

Post by Duncan »

the new version is up for download at any of the locations listed above the old version has been replaced

please re read the first post as to how to delete yoyr data at the end of the year this will apply to tabs B and D

basically i have redone it so you can hilght all your data and right click clear content but do not delete or alter any of the figures entered in column 1 hi-lighted orange this is what develops the graph from week one no matter where youy start during the year

dunc
Post Reply